Presentation-ready infographics, in minutes
Process diagrams, reports, and stat-driven layouts — built from 80+ widgets and 92 templates. Export PNG / SVG / PDF. Or write them in GraphMake Script — a Mermaid-like text syntax made for infographics.
Code or click
Write infographics in plain text with GraphMake Script — or skip the script and drag widgets. Your choice.
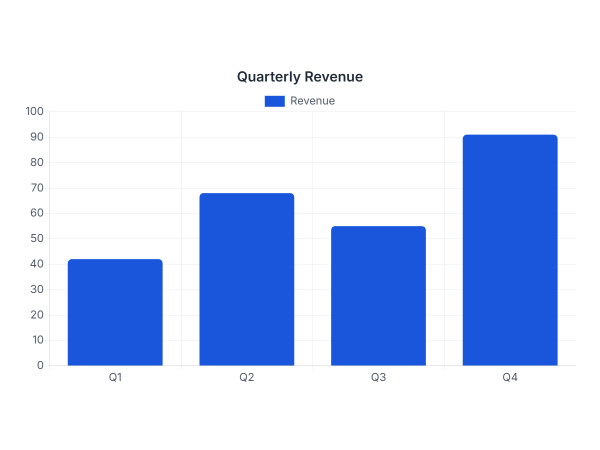
bar_chart "Q4 Revenue" {
  Jan: 24
  Feb: 31
  Mar: 28
}Why GraphMake
Everything Canva doesn't do
Built specifically for infographics — not generic slides, not flyers. Every feature serves one goal: making your data visual.
92 Ready-Made TemplatesQuick start
Business dashboards, health reports, tech overviews, food & environment — pick a template, swap your data, and export. Designed by us, customized by you.
80+ Widget TypesIncl. World Map
Charts, timelines, stat cards, process flows, pyramids, funnels, bullet lists, callouts, and now a fully interactive World Map — every infographic element you need.
World Map WidgetNew
Highlight countries on a real world map using ISO 3166-1 codes. Choose colors per region, pick projections, and include in any infographic — fully export-ready.
Layer Management
Full layer ordering: Bring to Front, Send to Back, step forward or backward. Select any element and instantly reorder it relative to every other widget.
Drag-and-Drop Canvas
Powered by Fabric.js — snap-to-grid, alignment guides, wheel zoom, unlimited undo/redo. Every widget is selectable, moveable, and resizable directly on the canvas.
Export Without a Paywall
Download PNG for free — no watermark, no account required. SVG and PDF export available for power users who need print-ready or vector output.
No Signup Required
Open the editor and start creating. We don't ask for your email, credit card, or life story to let you use the basic tool.
Why GraphMake
Three things that make GraphMake different from generic design tools.
Presentation-ready
Built for reports, dashboards, SOPs, pitches, and infographics — not blank canvases. Data visualization without writing code. 90+ templates, 80+ widgets, clean exports at any resolution.
Text syntax + visual editor
Write infographics in GraphMake Script (like Mermaid for charts), or build them visually. Switch between modes anytime.
See GraphMake Script →No signup. No watermark.
Free PNG, SVG, PDF export. Nothing uploaded to a server unless you save. Pro tier ($9/mo) for HD export and saved projects.
Widget Library
80+ widgets. Every infographic element you need.
Hover any widget to preview it. Drag, resize, layer, and style them all on a single canvas, then export as PNG, SVG, or PDF.
Bar Chart
Tap any widget below.
Data
Layout
Content
Visual
Diagram
Illustrations
Geo
All widgets are drag-and-drop, fully customizable, and export-ready as PNG, SVG, or PDF.
Open the editorHow it works
From data to infographic in 3 steps
Pick a template or start blank
Browse 92 professionally designed templates across business, health, tech, education, and more — or drag widgets onto a blank canvas.
Customize with 80+ widgets
Swap data, change colors, drag widgets, resize — make it yours. Charts, timelines, stat cards, world maps, and more.
Export and share
Download as high-quality PNG for free — no account, no watermark. Upgrade for SVG, PDF, and 3x resolution.
Templates
Start with a template
92 professionally designed templates across business, health, tech, and more. Replace the placeholder data with yours and export.


How we compare
The honest comparison nobody else shows you.
| Feature | GraphMake | Canva | Piktochart |
|---|---|---|---|
| 92 ready-made templates | ✓ | ✓ | ✓ |
| Free export (no watermark) | ✓ | ✕ | ✕ |
| No account required | ✓ | ✕ | ✕ |
| Infographic-focused | ✓ | ✕ | ✓ |
| World Map / Geo widget | ✓ | ✕ | ✕ |
| Modern editor | ✓ | ✓ | ✕ |
Your first infographic
is 2 minutes away.
Pick a template, customize your data, download your infographic. That's the whole flow.
No signup · No credit card · Export free