Free Branching Flowchart Maker Online
Diagrams & FlowsCreate branching flowcharts online for free. Use real decision diamonds, labeled Yes/No paths, 9 ANSI-style shape types, 4 visual themes, starter presets, and sharp PNG export. No signup, no watermark.
Free PNGNo signupNo watermark
Loading tool...
Was this tool helpful?
Watch the Tutorial
Open a real process, retype any label in place, use the selection toolbar to turn a step into a decision, then split a path into labelled Yes and No branches and turn the whole flow sideways.
How to Use
- 1
Pick a starter preset
Click Bug Triage, Support Escalation, Sign-up Validation, or Approval Workflow — or start from one and edit the labels.
- 2
Edit the nodes
In the left panel, change each node's label and shape type (process, decision, document, data, manual input, database, and more).
- 3
Add branches
Click the + on a decision node to add a Yes/No branch. Add additional children to any node for more complex logic.
- 4
Pick a theme
Switch between Corporate, Minimal, Bold, or Blueprint themes — colors, fills, and edge styles update instantly.
- 5
Download
Export as a sharp PNG with embedded fonts. Need more freedom? Open in the full Editor for canvas-style editing.
Why Choose GraphMake?
Create a Flow Diagram Online for Free
GraphMake covers the search intent behind flow chart creator, flow diagram maker, workflow chart maker, and process flow diagram tool. They all describe the same core need: draw steps, show the order, and make branches clear when the path changes.
Use the Flowchart maker when the diagram includes decisions, approvals, troubleshooting paths, loops, or exception handling. Use the process tools when the diagram is a simple linear sequence. That split keeps the final visual cleaner and prevents a process flow from becoming more complex than it needs to be.
You can start from a preset, edit every label, add custom branch names, and export the result as PNG. The tool runs in the browser and does not require login for basic creation and export.
What Makes This Flowchart Maker Different?
This redesigned flowchart maker is built around branching logic instead of a flat list of boxes. Start from a preset, edit each node in the left panel, add Yes/No branches from decision diamonds, switch between nine ANSI-style symbols, and preview the finished flowchart instantly.
The layout engine positions branches automatically, so you can focus on the logic instead of dragging every shape by hand. When the structure is ready, export a sharp PNG or open the flowchart in the full editor for canvas-style customization.
What Is a Flowchart?
A flowchart is a visual diagram that shows the steps of a process, a decision-making sequence, or a system's logic from start to finish. Each step is drawn as a shape, connected by arrows that indicate the direction of flow. Standard flowchart shapes have specific meanings: ovals for start and end, rectangles for actions, diamonds for decisions, parallelograms for inputs and outputs, and cylinders for data storage.
Flowcharts have been used since the 1920s to document industrial processes, and they became a standard tool in software engineering in the 1960s. Today they show up everywhere — developers use them to map code logic, operations teams use them to document workflows, customer support uses them to build troubleshooting trees, and businesses use them to visualize approval chains and onboarding sequences.
The power of a flowchart is that it takes something sequential and conditional — which is hard to explain in words — and makes it instantly scannable. A well-built flowchart answers "what happens next?" at every step without the reader having to hold state in their head.
When to Use Our Free Flowchart Maker
Use our free flowchart maker whenever you need to communicate a process that has conditional steps, branches, or decision points. If the process is purely linear — step 1, then step 2, then step 3 — a process steps widget at process diagram maker is simpler. But the moment you have "if this, then that" logic, a flowchart is the right tool.
Common use cases: mapping the user flow through a web application, documenting an incident response runbook, designing a yes/no decision tree for customer support routing, planning the logic of a new feature, explaining how an algorithm works, visualizing a purchase approval workflow, or onboarding a new team member to a complex process.
Our free online flowchart maker handles all of these. Unlike competitors that require sign-up or paywall the export, GraphMake works instantly in your browser and exports your flowchart as a PNG with no watermark. See our how to make flowchart guide for a step-by-step walkthrough.
Flowchart Symbols You'll Actually Use
Five shapes cover 90% of the flowcharts you'll ever build. The oval (or rounded rectangle) marks the start and end points — every flowchart begins and ends with one. The rectangle represents a process or action — something the system or user does. The diamond represents a decision — a yes/no or multi-way branch in the flow. The parallelogram represents input or output — data entering or leaving the process. The arrow, of course, connects everything and shows direction.
For more specialized flowcharts, you'll occasionally need other shapes: a cylinder for a database, a document shape for a printed or digital document, a circle as a connector to continue the flow on another page or location, and a hexagon for a preparation or setup step. Our flowchart symbols guide covers every standard shape with examples of when to use each one.
Our flowchart widget supports all the core symbols, and they're all styled consistently so your diagram looks professional without any tweaking. When you add a node, you pick the shape type from a dropdown — no hunting through libraries or remembering shortcuts.
Why GraphMake Beats Other Flowchart Makers
Most free flowchart makers have catches. Lucidchart gives you 3 documents before asking for credit card details. Canva adds a "Made in Canva" watermark to free exports. Draw.io is powerful but the interface is dated and the export options are clunky. Visme and Creately both require sign-up before you can save anything.
GraphMake is built differently. You open the flowchart maker, start from a preset, edit the nodes, and download a PNG — all without creating an account, seeing a paywall, or adding a watermark. The entire flow takes under two minutes for a simple diagram.
Beyond the flowchart itself, GraphMake is a full infographic builder. You can drop a flowchart alongside stat cards, charts, and text blocks in the same canvas to build a complete visual report — useful when you're documenting a process with performance metrics or explaining a workflow in a blog post. Our editor supports 60+ widget types so your flowchart never has to live on its own.
Flowchart Best Practices
Keep the direction consistent. A flowchart that reads top-to-bottom should stay top-to-bottom throughout — don't zigzag or reverse direction mid-diagram. This single rule makes flowcharts 10x more readable. Our flowchart best practices post covers more rules like this.
Label every arrow out of a decision diamond. A diamond with two unlabeled arrows is useless — the reader has to guess which one means "yes" and which means "no". Always write "Yes" and "No" (or the actual answer) on the arrow coming out of each decision point.
Limit a single flowchart to one screen's worth of shapes. If you have 50+ nodes, split the flowchart into sub-flows and use connector circles to reference them. A flowchart that requires scrolling to read is a flowchart that won't get read.
Use color sparingly. Color should encode meaning — red for error paths, green for the happy path — not decoration. A rainbow flowchart where every shape is a different color is harder to read than a single-color one. See our how to make process flow chart guide for examples of color done right.
Flowchart vs Workflow Chart — Is There Any Real Difference?
In practice, no. A workflow chart is a flowchart applied specifically to a business process — approvals, reviews, handoffs between people or teams. The shapes are the same: rectangles for actions, diamonds for decisions, arrows for flow direction. The word "workflow" just signals the domain. If someone searches for a "workflow chart maker", they are almost always looking for a flowchart tool they can use to document a business process.
Where the terms diverge slightly: "workflow chart" more often implies ownership — who does each step — and is frequently paired with swim lanes that label which team or role owns which action. A generic flowchart may or may not show ownership. So if you are documenting a cross-team business process where the handoffs matter, you are building a workflow chart. If you are documenting pure software logic or decision branching with no people involved, you are building a flowchart.
Our tool builds both from the same Flowchart widget. Drop the widget, add steps and decision diamonds, and use swim lane rectangles when you need to show team ownership. The output is identical regardless of which name you use for the result.
Flowchart vs Other Diagram Types
A flowchart shows a sequence with decision points. A process map shows a high-level overview of related processes without the decision logic — it's more zoomed out. If you need to document "what happens" rather than "how to decide what happens next," a process map at how to make process map is the better choice.
An org chart shows reporting relationships in a company hierarchy, not a sequence of actions. Use org chart maker for that. A decision tree is a specialized flowchart for classification or outcome prediction — try decision tree maker for those. And a mind map shows relationships between ideas without any sequential logic — mind map maker is built for that.
Export and Share Your Flowchart
When your flowchart is ready, click Download PNG — free, no watermark. Pro adds a vector SVG and HD PNG at 2×, 3× and 4× for print. Need a PDF or more layout freedom? Open in editor carries the flowchart into the full editor, which also exports PDF. PNG is fine for most uses — it opens everywhere, pastes into Google Docs and Slack, and works in emails.
For presentations and print materials, use the high-res PNG or SVG export. SVG is vector so it scales to any size without pixelation — critical if you're printing a flowchart on a poster or embedding it in a published document.
The entire export is free with no watermark. If you want to save your flowchart to continue editing later, you can either export as JSON (re-import any time) or sign in to save it to your account. Sign-in is free and just gives you cloud storage for your projects.
What You Can Create
Software Logic
Map out if/else branches, loops, and function calls in your code.
Business Workflows
Document approval workflows, onboarding sequences, or support escalation paths as workflow charts.
Decision Trees
Build yes/no decision flows for troubleshooting or customer routing.
Project Workflow
Outline project phases from kickoff to delivery with decision checkpoints and owner handoffs.
SOP Documentation
Turn a written standard operating procedure into a workflow chart anyone on the team can follow.
Start from a Template
Jump-start your design with a ready-made layout — just replace the data.
Prefer writing diagrams in text? Try GraphMake Script.
GraphMake Script is a text syntax for infographics. Paste a few lines and a Free Branching Flowchart Maker Online renders on the canvas. Edit it visually afterwards, then export PNG, SVG, or PDF.
title "Customer onboarding"
process_steps {
  Sign up: "Create your account"
  Verify email: "Click the link we sent"
  Set up workspace: "Pick a theme and invite teammates"
  Done: "Start using the app"
}Frequently Asked Questions
Can I create branching flowcharts?
Yes — this is a real branching flowchart maker. Decision nodes split into Yes/No paths (or any custom branch labels), and any node can have multiple children. The auto-layout positions branches cleanly without you needing to drag anything.
What flowchart shapes can I use?
Nine ANSI-style flowchart symbols: terminator (start/end pill), process (rectangle), decision (diamond), document (curved-bottom rectangle), data (parallelogram for input/output), manual input (slanted-top rectangle), predefined process (rectangle with side bars), database (cylinder), and off-page connector (pentagon). Pick from the dropdown next to each node.
Can I add decision branches?
Yes. The flowchart widget supports multiple node types including decision diamonds, process rectangles, and start/end terminators. Each node type is styled distinctly so readers can follow the logic at a glance.
Is this suitable for business process diagrams?
Absolutely. Use it for business processes, workflows, algorithms, approval chains, or any sequential flow. For linear step-by-step processes without branching, you might also try our Process Steps widget at /tools/process-diagram-maker.
Can I combine a flowchart with other widgets?
Yes — our modular system lets you combine flowcharts with stat cards, charts, text blocks, and 20+ other widget types in a single infographic.
Do I need to install anything?
No. Everything runs in your browser — no downloads, no plugins, no signup.
How do I create a flowchart online for free?
Open /tools/flowchart-maker — no signup or install needed. Start from a preset such as Login flow or Approval process, edit each node in the Data panel, add Yes/No branches from decision diamonds, then download a PNG. It's free with no watermark. Learn more in our step-by-step guide at /blog/how-to-make-flowchart.
Can I use this as a free online flow chart creator?
Yes. GraphMake works as a free online flow chart creator: add start/end nodes, process rectangles, decision diamonds, and labeled arrows directly in your browser. You do not need to install software or create an account to build and export a PNG.
Can I create a flow diagram online free?
Yes. Use the Flowchart maker for flow diagrams with decisions, loops, or branches. If your flow diagram is purely linear, use /tools/process-diagram-maker; if it has yes/no paths or approval gates, this Flowchart maker is the better fit.
Can I draw a flow chart online free without login?
Yes. You can draw a flow chart online without logging in. Open the tool, edit the preset or start from scratch, then download the flowchart as PNG. Signing in is only needed if you want cloud project storage.
Can I create a process flow diagram online?
Yes. For process flows with decisions, use this Flowchart maker and add diamond nodes for each branch. For simple step-by-step processes with no branching, /tools/process-flow-maker or /tools/process-diagram-maker will produce a cleaner linear layout.
What's the difference between a flowchart and a process diagram?
A flowchart includes decision points (yes/no branches) that split the flow into different paths. A process diagram shows a linear sequence of steps without branching. Use our flowchart widget for decision-based flows and the Process Steps widget at /tools/process-diagram-maker for straight-line processes. Our /blog/how-to-make-flowchart guide covers when to use each format.
Is a workflow chart the same as a flowchart?
Effectively yes. A workflow chart is a flowchart applied specifically to a business process — the visual conventions (rectangles for steps, diamonds for decisions, arrows for direction) are identical. The term "workflow chart" emphasizes the business context (approvals, handoffs, team processes); "flowchart" is the general name.
Can I add swim lanes for multi-team workflows?
Yes — in the full /editor, drop background rectangles as swim lanes and place steps inside each lane to show which team or role owns each step. Swim lanes are essential when a workflow crosses team boundaries.
Related Tools
Free Process Diagram Maker
Design clear process diagrams and step-by-step visuals online for free. Perfect for workflows, SOPs, tutorials, and onboarding guides. Export as PNG.
Try it freeFlowchart Symbols Reference
Quick-reference guide to all flowchart symbols and their meanings. Learn what ovals, diamonds, rectangles, parallelograms, and other shapes mean in flow diagrams. Free printable cheat sheet.
Try it freeFree Timeline Maker
Create timelines online for free. Project milestones, company history, event schedules. Drag-and-drop timeline generator — export as PNG, no signup.
Try it freeFree Org Chart Maker
Build organizational charts and organograms online for free. Visualize team structures, reporting lines, and company hierarchy. Export as PNG — no signup needed.
Try it freeLearn More

Flowchart Examples: 15 Flow Chart Examples for Work and Decisions
See 15 flowchart examples for business processes, decisions, troubleshooting, onboarding, software, marketing, and personal workflows. Build yours free online.
Read more
How to Make a Flowchart: A Step-by-Step Guide
Learn how to create clear, effective flowcharts for any process. Covers flowchart symbols, when to use flowcharts vs other diagrams, step-by-step instructions, examples, and design tips.
Read more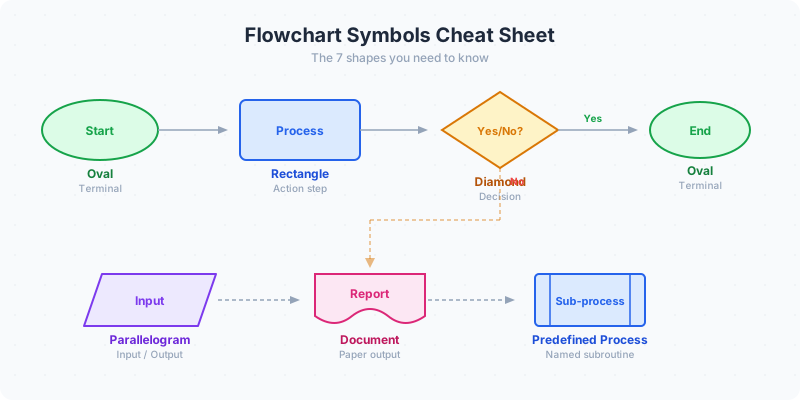
Flowchart Symbols Guide: Shapes, Meanings & Examples (2026)
Flowchart symbols defined with examples: oval start/end, rectangle process, diamond decision, parallelogram input/output, arrows, connectors, documents, and database shapes.
Read more
Flowchart Best Practices: 10 Rules for Clear Diagrams
Ten proven rules for designing flowcharts that are easy to follow and hard to misread. Covers shape usage, layout, labels, and common mistakes to avoid.
Read more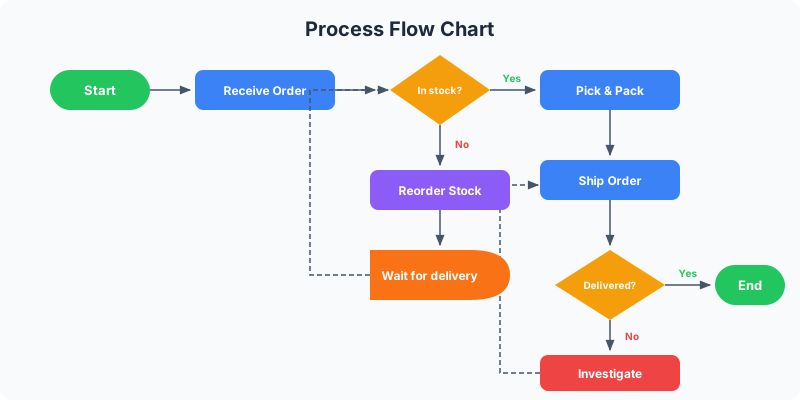
How to Make a Process Flow Chart — Free Maker + Examples (2026)
Create a process flow chart in minutes. Step-by-step guide with 5 real examples, best practices, and a free online process diagram maker. No signup needed.
Read more