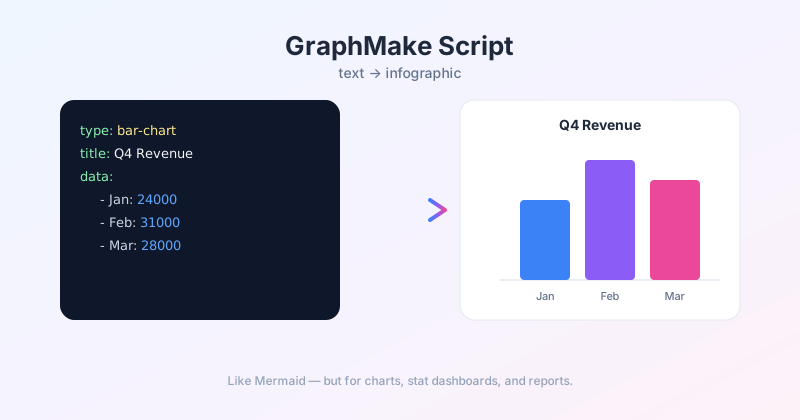
Why text-based diagrams matter
For a decade, diagrams were drawn by hand. Then Mermaid and PlantUML proved that text can be a better source format: version-controllable, copy-pasteable, easy for LLMs to generate, easy for humans to skim and patch. A flowchart in text becomes a first-class artifact you can keep in a README, a Notion doc, or a prompt.
Where Mermaid stops
Mermaid is great for flowcharts, sequence diagrams, and ER diagrams. It does not handle charts, stat dashboards, comparison tables, or the kind of polished, presentation-ready visuals you put in a report. PlantUML is similar. For everything else, you go back to clicking around in a GUI.
Introducing GraphMake Script
GraphMake Script is a YAML-style text syntax that produces full infographics — charts, stat dashboards, timelines, process flows, mind maps, Gantt charts, comparison tables, and 80+ other widget types. It is designed to be readable, easy for an LLM to generate, and editable on a visual canvas after the script renders.
Paste a script into the editor at editor (Script tab) and it renders instantly. From there you can drag widgets, recolor, swap fonts, and export to PNG, SVG, or PDF. The /script page has the full reference and live examples.
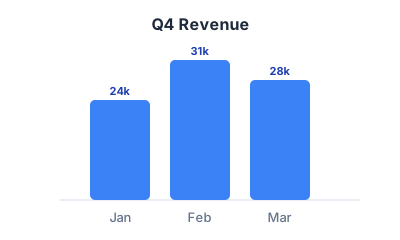
Example 1 — Quarterly sales bar chart
Three lines of data, one rendered chart. Recolor or change the bar width visually after pasting.
``` bar_chart "Q4 Revenue" { Jan: 24 Feb: 31 Mar: 28 } ```
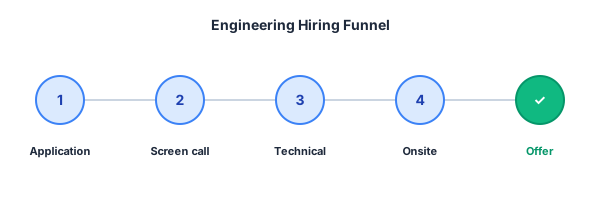
Example 2 — Hiring process flowchart
A five-step linear process. Each step gets a title and an optional description.
``` process_steps { Application: "Submit resume + cover letter" Screen call: "30-minute phone chat with recruiter" Technical: "Take-home coding exercise" Onsite: "Half-day with the team" Offer: "Sign and join" } ```
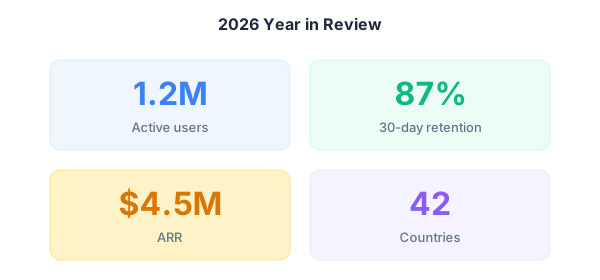
Example 3 — Year-in-review stat dashboard
Consecutive kpi commands auto-group into a row of stat cards. Great for reports, year-end summaries, and pitch decks.
``` title "2026 Year in Review" kpi "Active users" "1.2M" icon=users kpi "Retention" "87%" icon=trending-up kpi "ARR" "$4.5M" icon=dollar-sign kpi "Countries" "42" icon=globe ```
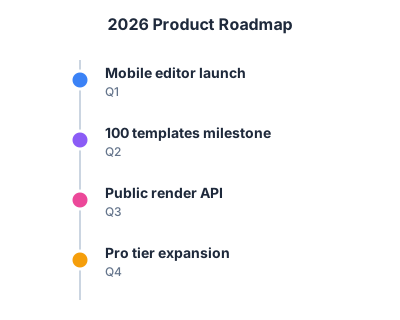
Example 4 — Product roadmap timeline
A timeline with four milestones. Each entry has a label, a title, and an optional description.
``` timeline { Q1: "Launch" "Mobile editor" Q2: "Milestone" "100 templates" Q3: "API" "Public render API" Q4: "Expand" "Pro tier" } ```
Ready to build?
Open the free editor and start creating — no signup needed.
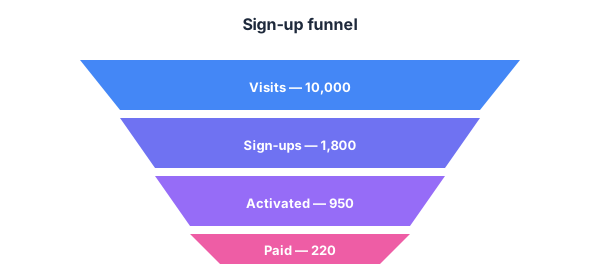
Example 5 — Funnel for conversion stages
A funnel widget for visualizing drop-off across stages. Common for marketing reports, sales pipelines, and onboarding analysis.
``` funnel "Sign-up funnel" { Visits: 10000 Sign-ups: 1800 Activated: 950 Paid: 220 } ```
Using LLMs to write GraphMake Script
Both ChatGPT and Claude can write GraphMake Script if you give them a short system prompt. Paste the script into the editor afterwards to render and refine.
Here is a starter prompt that works in either:
``` You are a GraphMake Script generator. GraphMake Script is a line-based syntax for infographics. Commands include: bar_chart "Title" { Q1: 42 ... }, kpi "Label" "Value" icon=users, process_steps { Step1: "desc" Step2: "desc" }, timeline { 2024: "Founded" "..." 2025: "Series A" "..." }, pie_chart, line_chart, area_chart, radar_chart, progress, percentage, gauge, waffle, rating, counter, funnel, pyramid, cycle, map, word_cloud, text, quote, list, heading. Add `title "..."` at the top. One command per line; block bodies inside { }. Output ONLY the script, no commentary. Render at https://graphmake.comeditor (Script tab) or POST to /api/render-script. ```
Hand any natural-language description to the LLM with that prompt prepended and it will produce a script you can paste directly into the editor.
Why this matters for AI agents
Agentic AI tools — Claude's Chrome extension, ChatGPT operators, Manus, custom browser agents — struggle with most design tools because the surface is a drag-and-drop canvas. GraphMake Script gives those agents a deterministic, structured input surface they can actually use. Write a script, paste it, render, done — no DOM scraping, no flaky UI automation.
For fully programmatic use, GraphMake exposes a public render API at /api/render-script. POST a script, get back SVG or PNG — no browser needed. See the /script page for examples in curl, Node, and Python.
When NOT to use script
If you need a one-off custom layout, a hand-drawn aesthetic, or pixel-perfect arrangement of arbitrary elements, the visual editor is faster. Script is best for content that has structure — charts, lists, dashboards, processes — where the layout comes from the data.
Try it
Open the /script reference page for the full syntax, or jump straight to editor and try writing a script. Both are free and no signup required.