Org Charts Are Strategy Documents
Most people treat org charts as HR paperwork. They are actually strategy documents. The way you structure reporting lines determines how decisions get made, how information flows, and where bottlenecks form.
A badly designed org chart creates confusion, duplicated work, and slow decision-making. A well-designed one makes responsibilities clear and communication paths obvious.
These 10 examples cover structures for different company sizes and industries. Build any of them at org chart maker, or use hierarchy chart maker for custom hierarchy layouts.
1. Classic Corporate Hierarchy
CEO at the top, C-suite below, VPs below them, directors, managers, individual contributors at the bottom. This is the default for companies with 200+ employees because it creates clear chains of command.
Strengths: unambiguous reporting, clear promotion paths, defined accountability. Weaknesses: slow decision-making, information gets filtered through layers, silos between departments.
When building this in org chart maker, limit the depth to 4-5 levels. More than that and the chart becomes unreadable. For very large organizations, create separate charts per division.

2. Flat Startup Structure and 3. Functional Organization
Flat startup (2): Founder/CEO with 5-8 direct reports, no middle management. Everyone reports to the top. This works for companies under 20 people. Beyond that, the CEO becomes a bottleneck because every decision funnels through one person.
The visual is simple: one box at the top, one row below. But this simplicity is the point — it communicates "we are small, we are fast, everyone has access to leadership."
Functional organization (3): Groups people by what they do — Engineering, Marketing, Sales, Operations. Each function has its own VP or Director. This is the most common structure for companies with 50-500 employees. It enables deep specialization but can create silos where teams optimize for their function instead of the customer.
4. Matrix Organization and 5. Divisional Structure
Matrix (4): Employees report to both a functional manager (e.g., Head of Engineering) and a project manager (e.g., Product Lead for Mobile). This dual reporting creates flexibility but also confusion about priorities.
On the chart, matrix structures show dotted lines for secondary reporting and solid lines for primary. If your org chart has more dotted lines than solid ones, your matrix has become chaos.
Divisional (5): Each product line, geography, or customer segment operates as a semi-independent division with its own functional teams. Google's Alphabet structure is the textbook example — each company (Waymo, DeepMind, YouTube) runs independently.
Divisional charts look like multiple small hierarchies under one umbrella. Build them using org chart maker by creating separate branches for each division. See how to create infographic for layout tips when combining multiple chart types.
6. Department Breakdown and 7. Project Team Structure
Department breakdown (6): Zoom into a single department — say, Marketing — and show its internal structure. Content Team, Paid Ads Team, Brand Team, Analytics Team, each with a team lead and 2-5 members.
This is the chart you share during department all-hands or when onboarding new hires. It answers "who do I talk to about X?" Keep it updated — nothing erodes trust faster than an org chart that shows people who left six months ago.
Project team structure (7): Cross-functional teams assembled for a specific initiative. A project lead at the top, with borrowed members from Engineering, Design, Marketing, and Data. Show their home department with a secondary label.
Project team org charts have a shelf life — they are valid for the duration of the project. Use color-coding to indicate which home department each person comes from.

Ready to build?
Open the free editor and start creating — no signup needed.
8. Network/Team-of-Teams and 9. Hybrid Remote Structure
Network structure (8): No traditional hierarchy. Instead, self-organizing teams connect through shared goals and communication protocols. Think of it as a graph, not a tree. Valve and some Spotify-model companies use this.
Visually, this looks more like a venn diagram maker output than a traditional org chart — overlapping circles of teams with shared members at intersections. It is harder to draw but honestly represents how work actually flows in many modern companies.
Hybrid remote (9): Shows both physical location and reporting structure. Office-based teams in one section, remote teams in another, with cross-location reporting lines. Color-code by timezone to make coordination challenges visible.
Hybrid org charts need a "communication protocol" layer: which meetings are mandatory? Who is the timezone bridge between teams? Surface these in annotations on the chart.
10. Board and Advisory Structure
Board of Directors at the top, CEO reporting to the board, advisory groups (legal, financial, technical advisors) shown as lateral connections. This chart is for investor decks and governance documentation.
Show board committees (Audit, Compensation, Nominating) as sub-groups. Advisory roles use dotted lines since they influence but do not command.
For startups, include the cap table hierarchy: investors → board seats → management. This tells a story about governance that pure reporting lines miss. Combine this with stat cards and timeline widgets in editor for a complete governance infographic.
Explore templates for pre-built organizational layouts that you can customize with your team's actual data. The org chart widget works in any template.
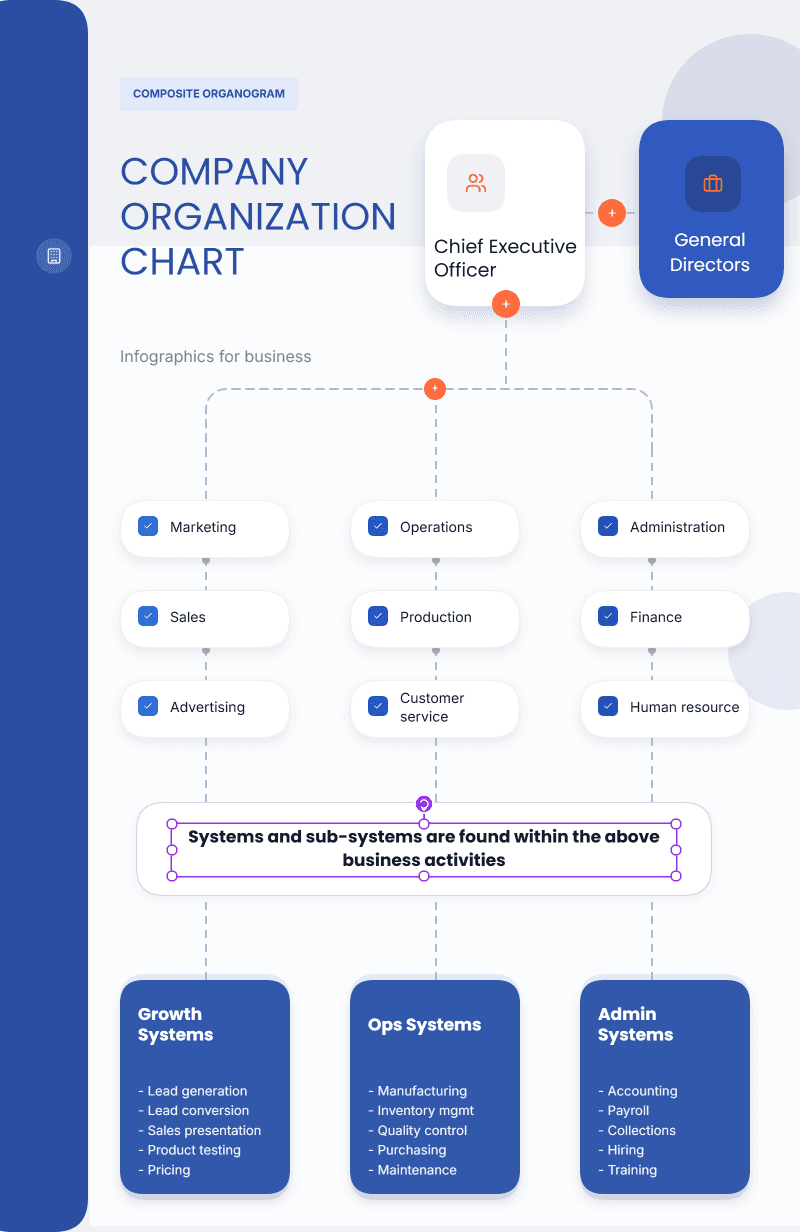
Build a Custom Org Chart with Composite Widgets
The org chart maker widget covers 90% of use cases — but when you need a layout no widget supports, composite widgets are the answer. Combine Shape widgets for role cards, Icon widgets for avatars or status dots, Divider widgets for reporting lines, and Text Block widgets for names and titles. Stack them on the editor canvas and every element is independently draggable, recolorable, and resizable.
The example above shows a department-swimlane layout — horizontal bands per function (Engineering, Product, Design) with team members inside each band. Built entirely from basic shapes and text blocks, not the org chart widget. This layout makes cross-functional relationships obvious in a way a traditional top-down tree cannot.

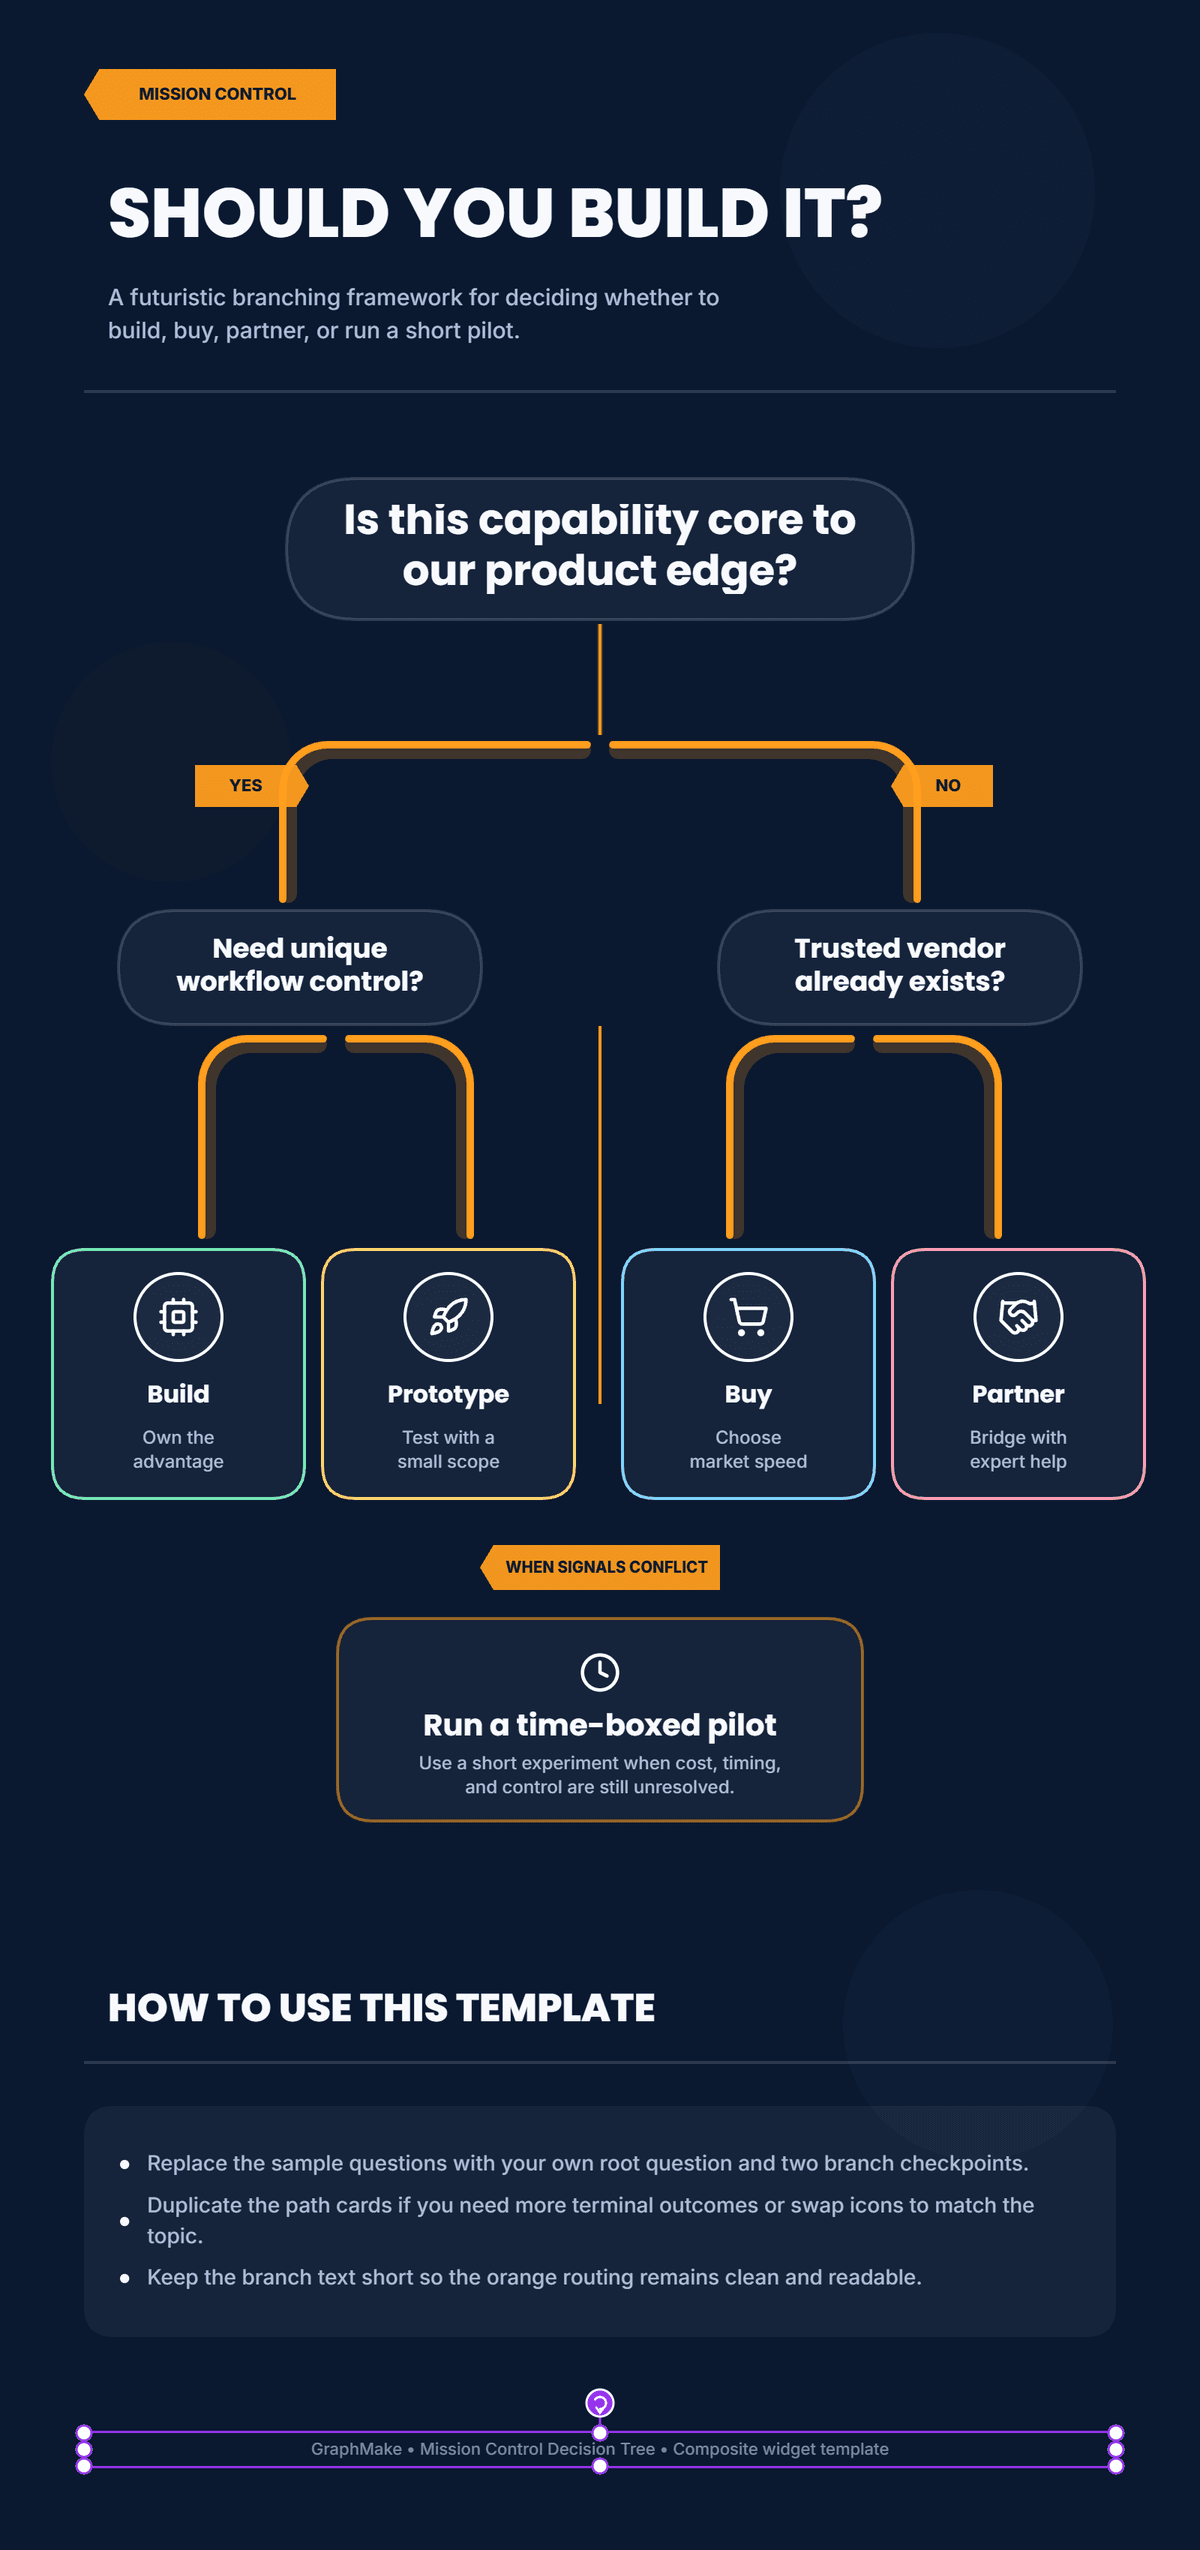
Horizontal Tree with Status Indicators
A second composite example — a left-to-right horizontal tree with colored status indicators per role (open, filled, hiring). Useful for hiring plans and quarterly headcount reviews. The connectors are composed from elbow segments built with accent bars; the status pills are small gradient badges.
This is the power of composite design: once you understand that every widget is an independent object on the canvas, you can build any org chart visual you can sketch. Start from organogram showcase for a clean base, then replace sections with composites where you need custom layouts.